PinnySharp shows one thing only: when a sharp book moves a price, and by how much. Everything else on the page exists to provide context to that movement.
The list
Each row is a detected movement. From left to right: time to kick-off, teams and competition, percentage drop with time since detection, and the market where it occurred — with the new odds, available limit, and calculated fair price.
The tabs at the top divide by event type: odds drops, opening lines, and limit changes. Below that, sports are listed with a count of what is active in each right now.
The detail panel
Clicking a row opens the history for that specific market.
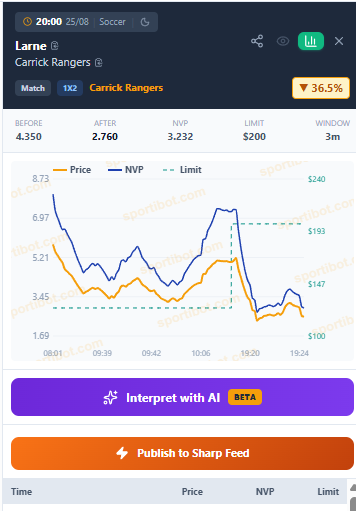
Three overlaid series. Orange is the published price. Blue is the fair price, with margin removed. Green dashed is the maximum bet limit, on its own scale — what matters about it is the shape, not the absolute value.
Reading them together tells you something. Price dropping with limit rising means the book believes the new number and wants more volume. Price dropping with limit dropping is usually exposure to correct, not conviction. Below the chart is the table with each update recorded to the second.
Alerts
No one can watch six hundred movements a day. Alert profiles filter the feed down to what matters to each person.
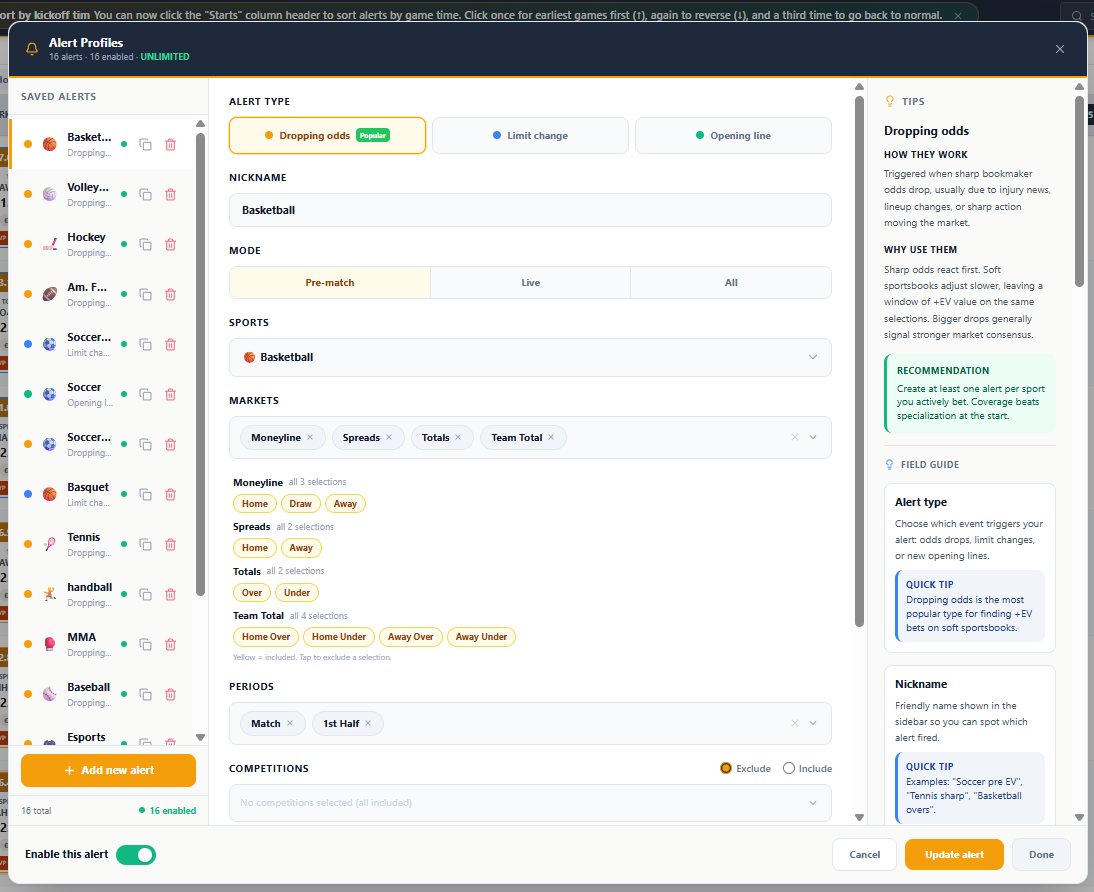
Each profile defines the event type, sport, markets and selections, periods and competitions. One profile can be as broad as "all football" or as narrow as "first half Asian handicap, only in three competitions". Alerts arrive at the terminal and, optionally, on Telegram.
Assisted reading
Some alerts have a large history of similar cases. When one exists, the terminal shows what happened to those cases.
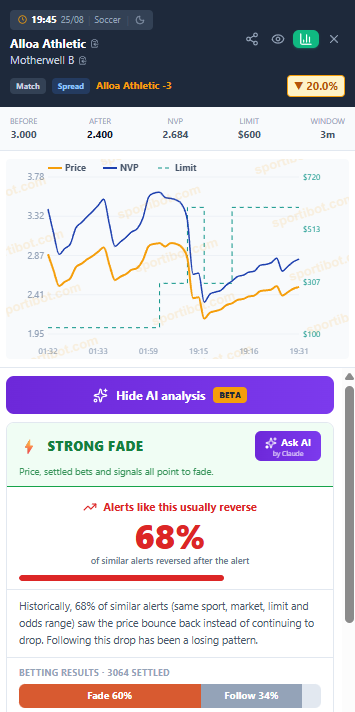
The number shown is the frequency with which alerts from the same profile — same sport, market, limit range and odds range — reversed rather than continued to fall. It is not a prediction of the game result; it is observed price behaviour in comparable situations.
It is worth distinguishing two things that are often confused: the probability of the price reversing is not the same as the probability of the bet winning. And neither of those is profitability — that depends on the odds you enter at.
Game context
From any alert, Scout opens all markets for that game at the same time.
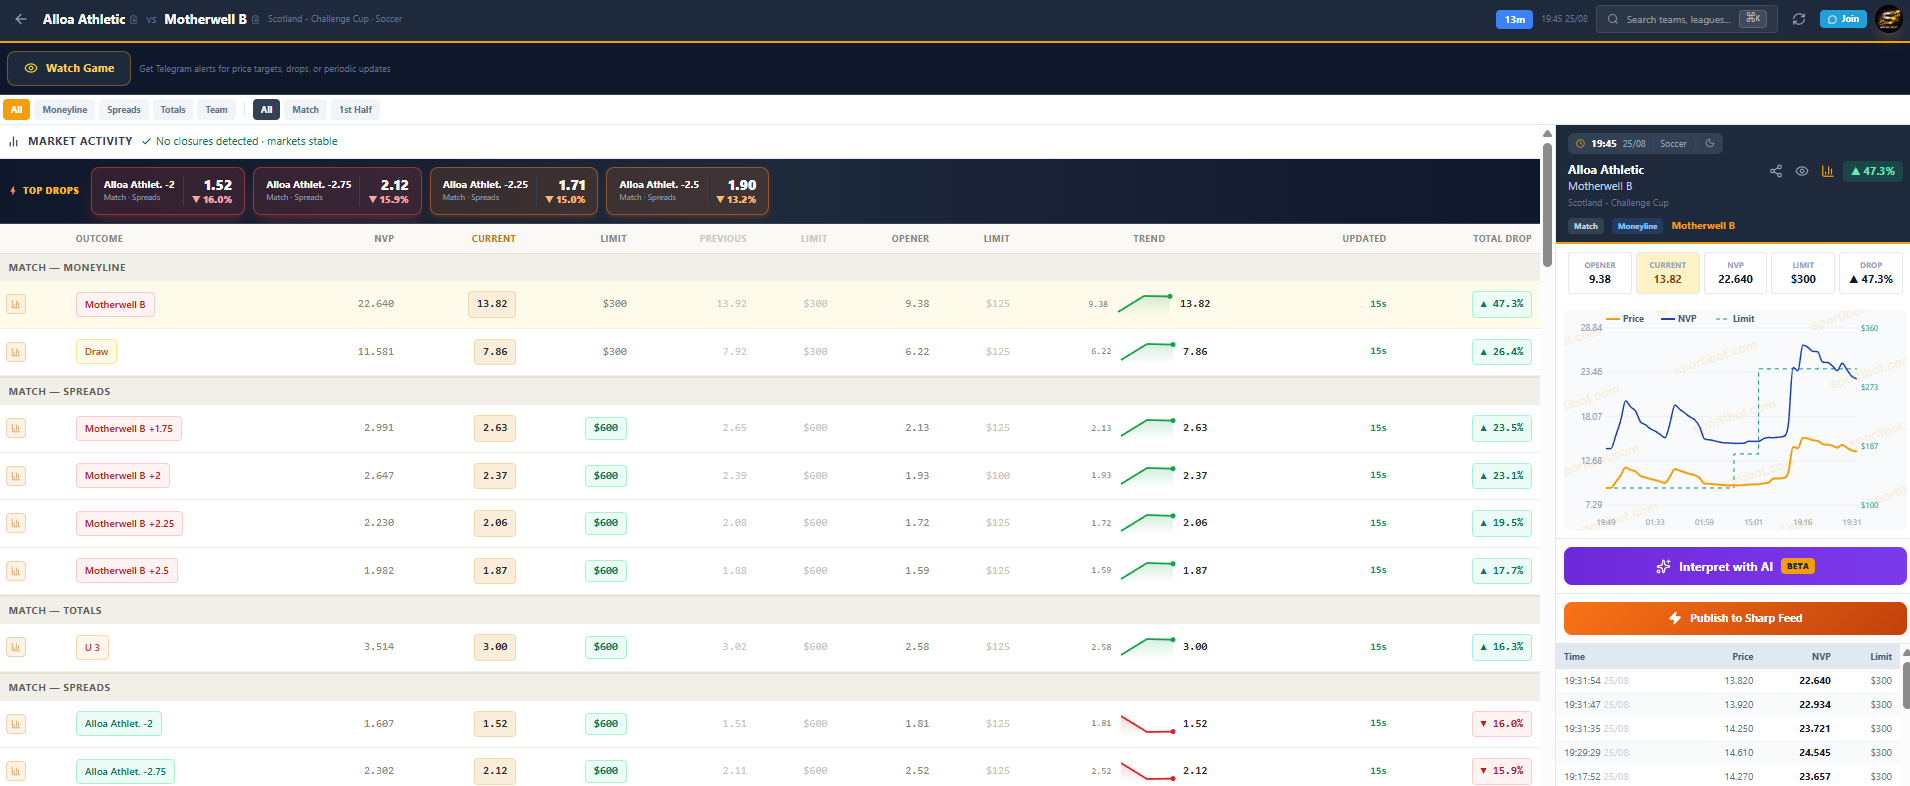
It serves to see whether the movement is isolated in one market or whether the entire line is shifting. A handicap moving alone tells a different story than a handicap moving with the moneyline and totals following along.
Record
Tracker stores placed bets and measures them.
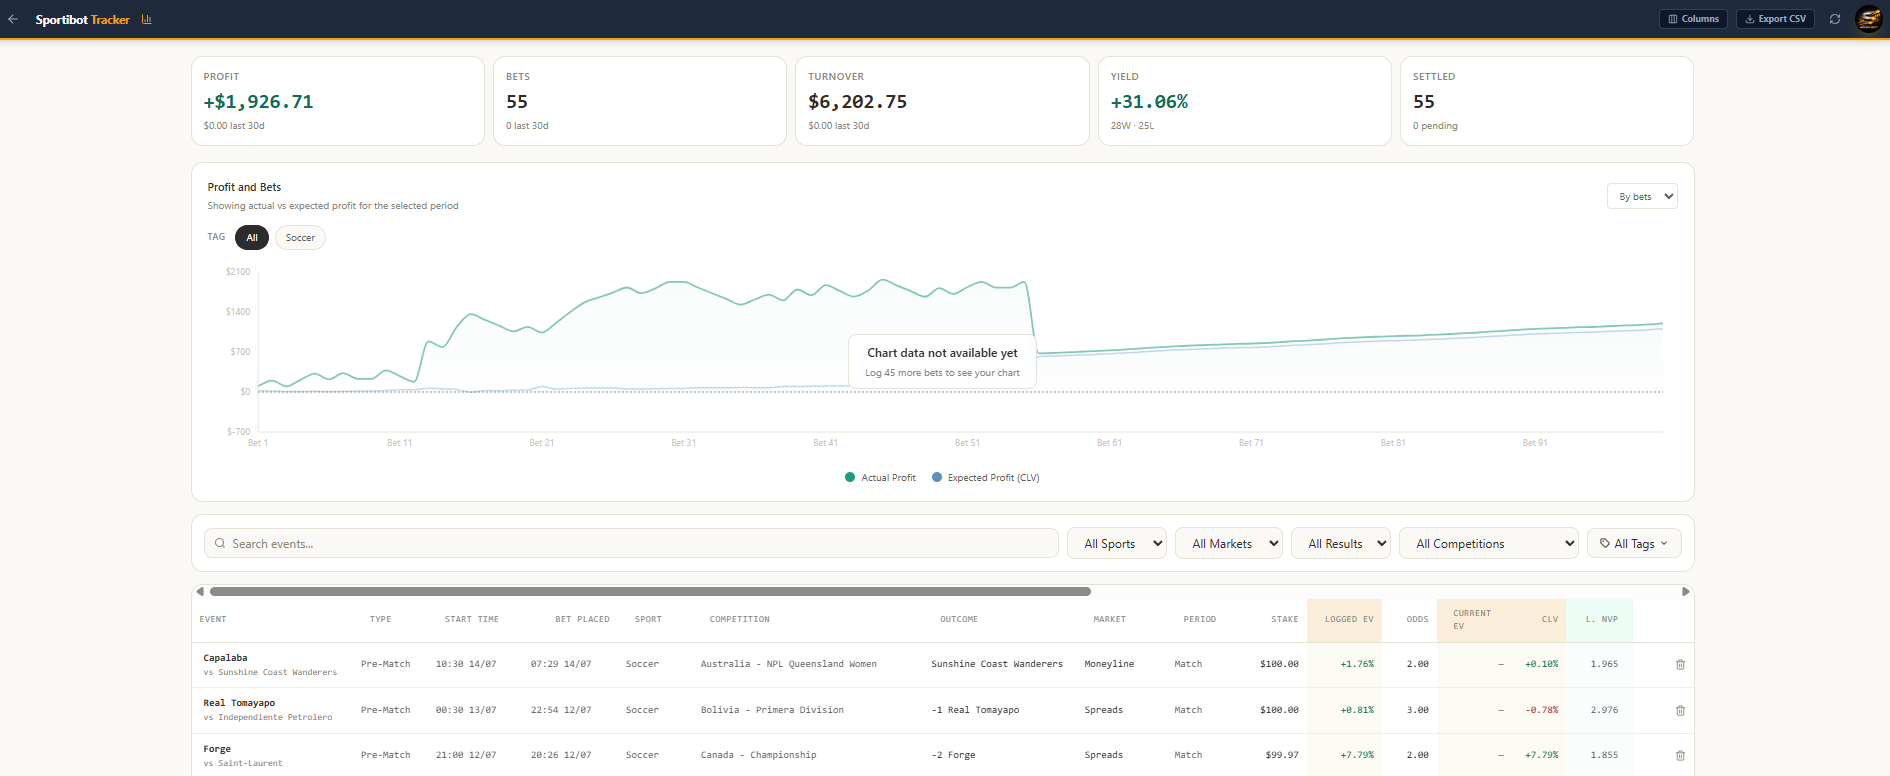
Profit, volume and yield are the easy part. The column that matters most is value against the closing line, calculated automatically for each bet when the market closes — the metric that converges well before win rate does.
What the terminal does not do
It does not tell you what to bet on. It shows what the market is doing and gives you the tools to interpret it. The decision, and the price at which you enter, are yours.